Actions
Activity #2464
closedFeature #1855: Design and Development for Dashboard Visualization
Activity #2221: Create a dashboard with simulated data
Sub module #2253: Dashboard 1 Panel configuration
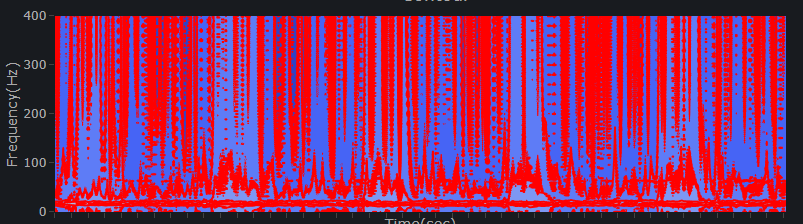
Panel 1.4 -- Contour Plot
Start date:
04/09/2024
Due date:
04/09/2024
% Done:
100%
Estimated time:
Planned Due Date:
Description
- contour plot to show
- Integrate a separate API to fetch spectrogram data with inputs date and time from Database
- Dataset with two date and time to simulate in Database
- Auto refresh to work to show plots for these two date and time
@Shameera S L, to review
Files
Actions