Activity #1857
closed
Feature #1855: Design and Development for Dashboard Visualization
Explore and create a dataasource
Added by Thara S Pillai over 2 years ago.
Updated over 2 years ago.
Description
Create Datasources
configure display panels, configure APIs to run each panel, schedule refresh times.
Explore on free APIs avaialble for time domain or frequency domain signal responses and integration with grafana
Files
- Status changed from New to In Progress
- % Done changed from 0 to 10
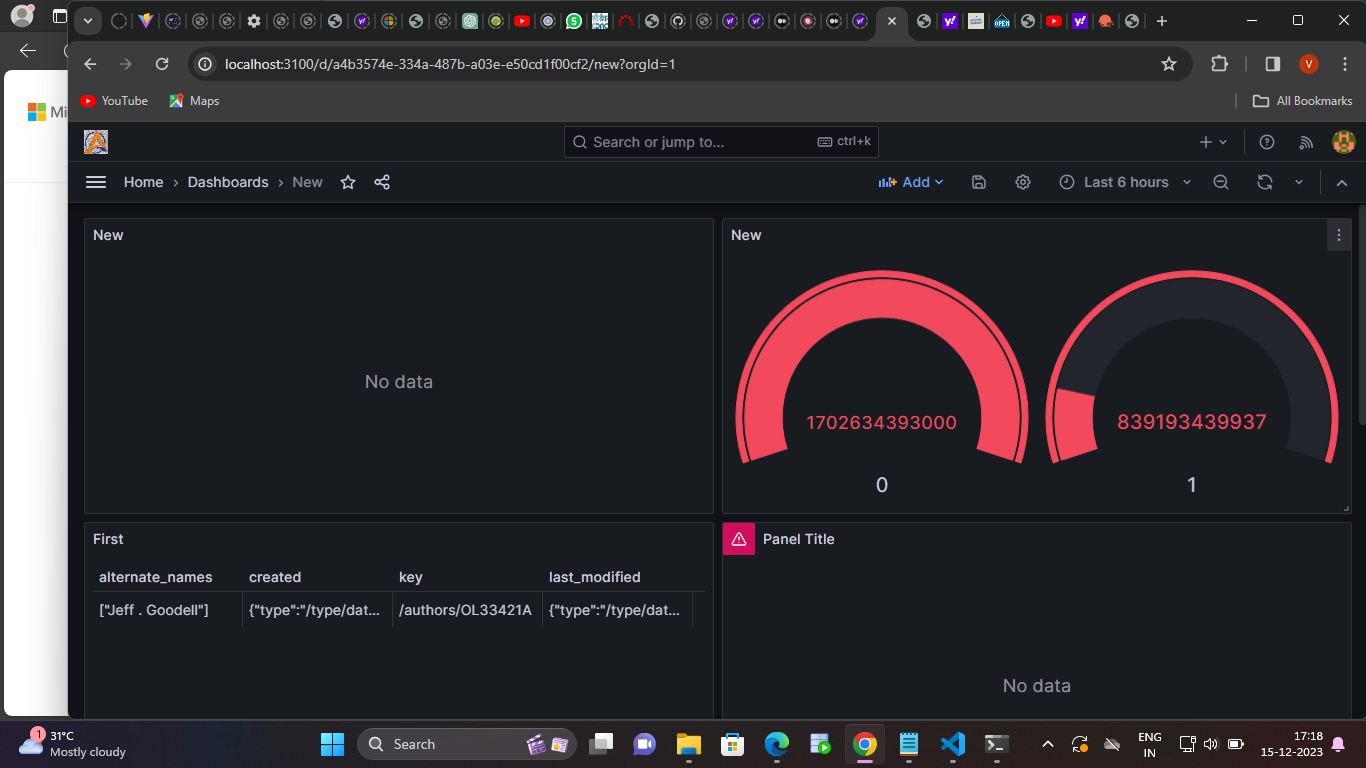
I create data source , configure panel , use data source as infinity DB and JSON API . By using this done a Guage in dashbord.
Update activity status.
Explore free APIs for generating images, heatmaps, time domain data
Include in display panels.
- % Done changed from 80 to 90
Also installed JMeter. Done image through API in dashboard .
- % Done changed from 90 to 100
- Status changed from In Progress to Resolved
- Status changed from Resolved to Closed
Also available in: Atom
PDF